
Figure 1 – Elastic Joint Concept
Two plastic tubes needed to be connected in a flexible way, i.e. allowing them to rotate one to each other (Figure 1), while still being capable to withstand the internal pressure of the fluid.
Because of the high internal pressure and the big rotation angle required, it was clear to our Customer that some simulations were necessary in order not to enter into an endless trial & error process and CG CAE was chosen as the partner to perform those simulations because of our experience in dealing with high tech and/or particular materials, like rubber is, and because of our strong knowledge in highly non linear models.
For this case, the nonlinearities are coming from the material (hyperelasticity) and from the contacts between the pins (used to realize the pivot axis) and the two flanges.
Because of the kind of structure, only half a model has been built and the proper symmetry boundary conditions were applied at the section plane (see Figure 2).
Tetrahedral second-order elements (10 nodes) were used in a rather coarse mesh for the two flanges, for whom there was no interest at all, while 8 nodes hexahedral elements (bricks) were used to model the rubber part with a finer mesh.
Internal pressure, imposed rotation and a pulling force (axial) were applied as load step to the model.
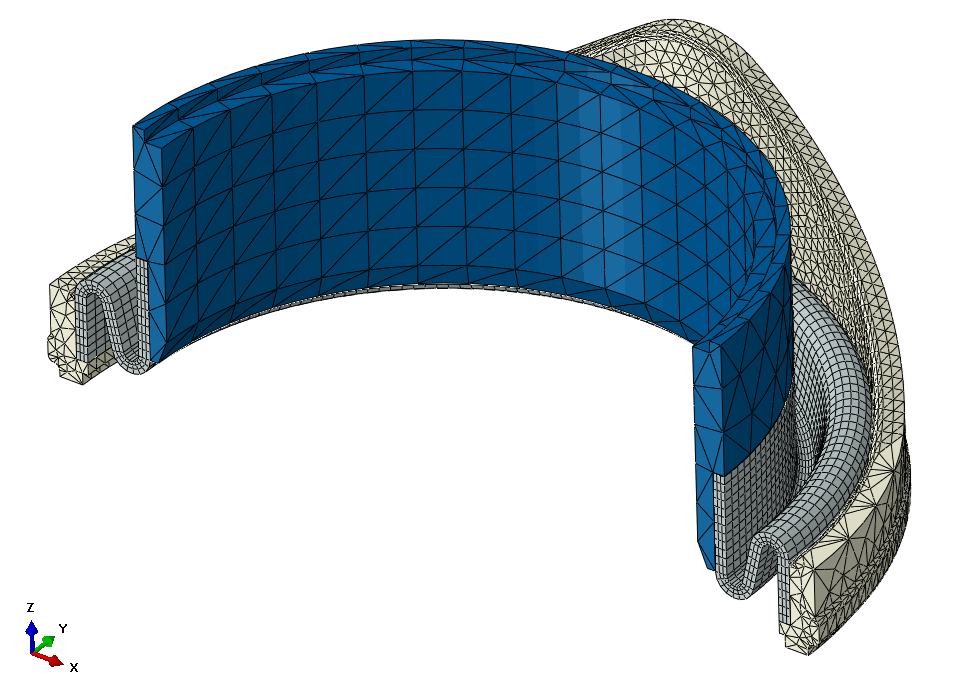
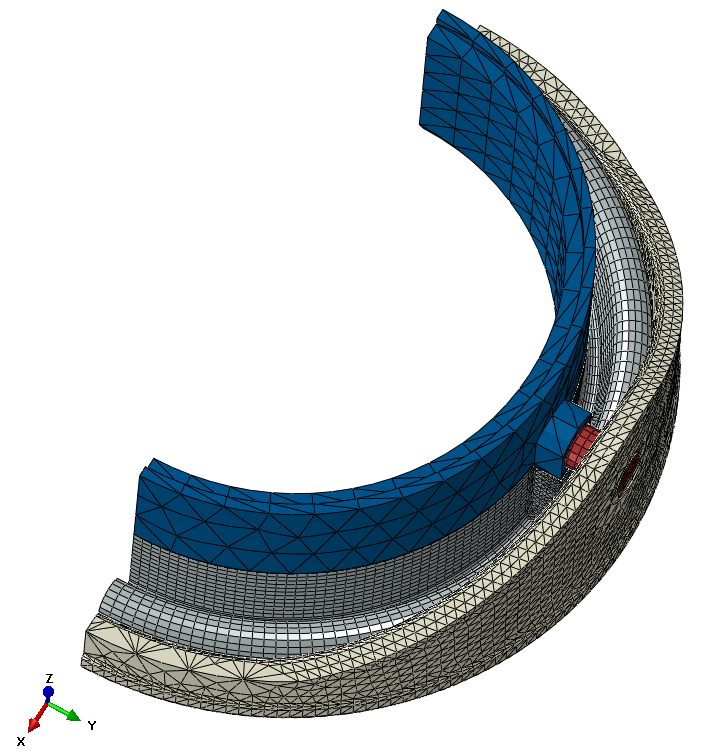
Figure 2
Each kind of rubber has its own properties and the Shore hardness will only tell a little portion of the whole story. Such materials require at least a uniaxial test, in both compression and tension in order to find out the hyperelastic material model that better suites the test data. This has been done and the results are shown in Figure 3.

Figure 3 – Material model and experimental data
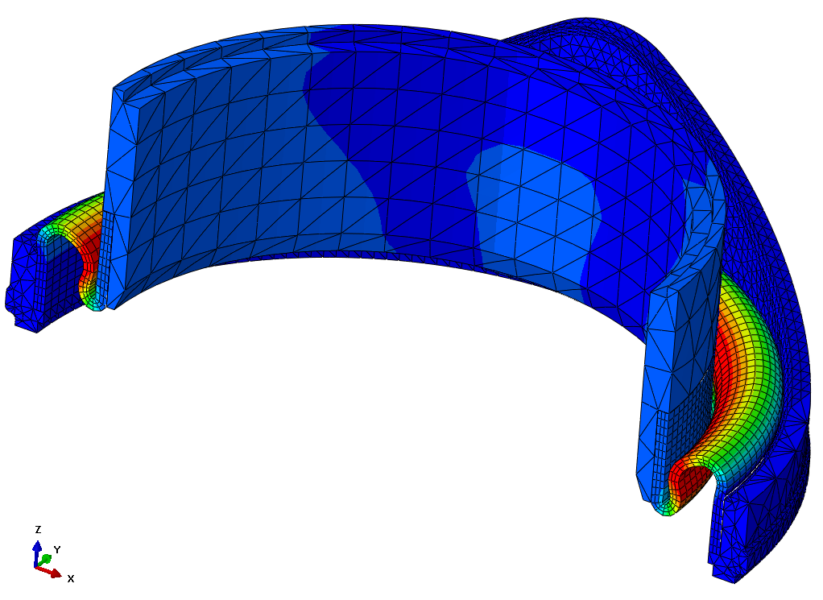
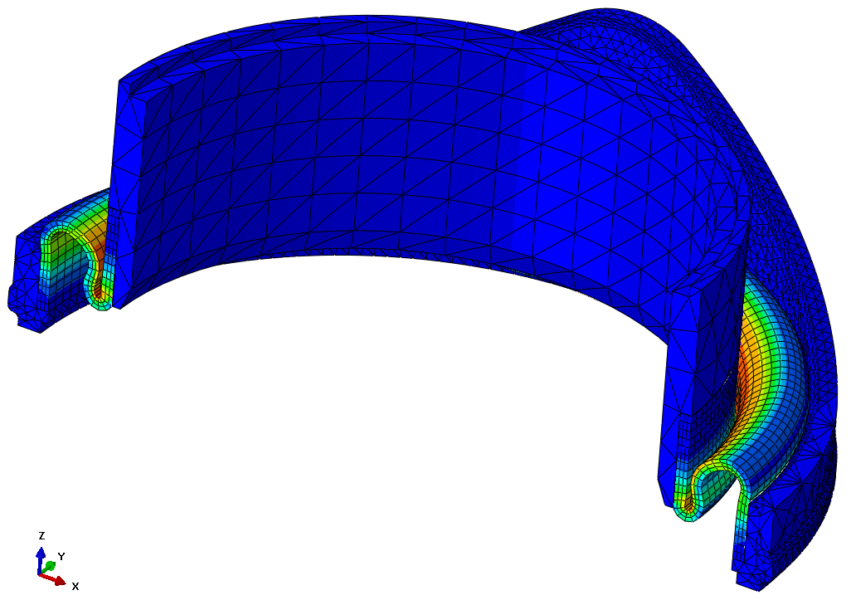
Figure 4 – Displacement magnitude and Maximum Principal Strain
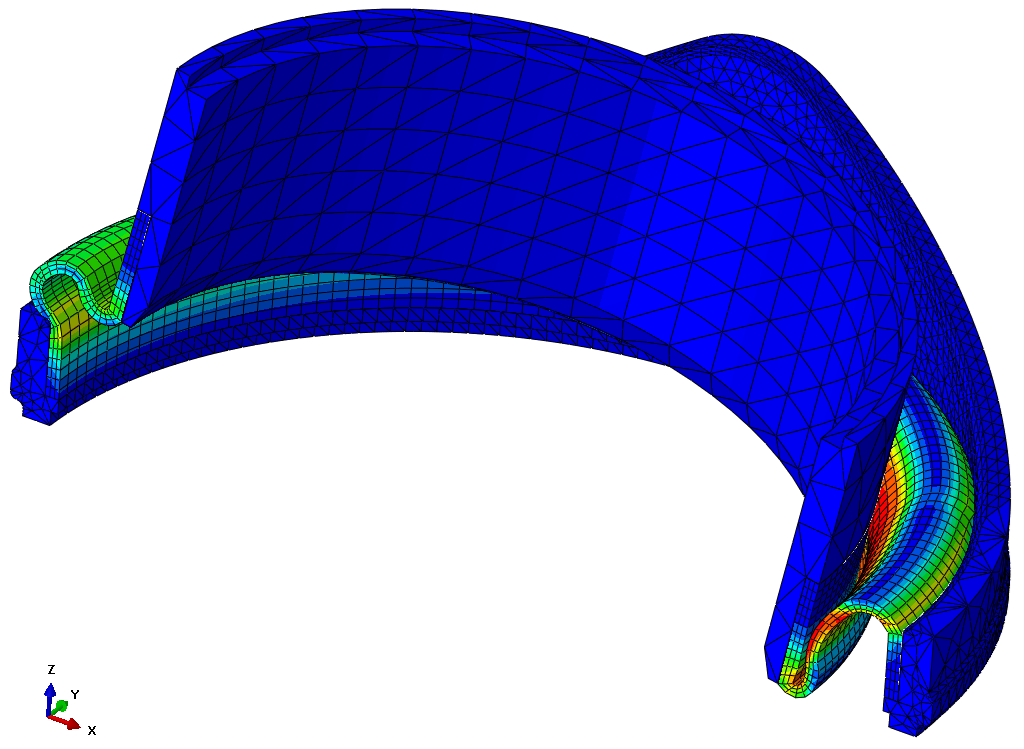
Figure 5 – Maximum Principal Strain
Finally, Figure 6 illustrates a section taken along the pivot axis when the design pullout force is applied (Von Mises stress)

Figure 6 – Von Mises stress
The simulation results were compared with the hyperelastic material properties and our Customer decided to produce some parts to be tested and the test were successful, so that series production could start.
Privacy Settings
This website uses cookies to improve your experience while you navigate through the website.
View the Cookie Policy View the Personal Data Policy
Google Analytics is a web analytics service provided by Google Ireland Limited ("Google"). Google uses the collected personal data to track and examine the usage of this website, compile reports on its activities, and share them with other Google services. Google may use your personal data to contextualize and personalize the ads of its advertising network. This integration of Google Analytics anonymizes your IP address. The data sent is collected for the purposes of personalizing the experience and statistical tracking. You can find more information on the "More information on Google's handling of personal information" page.
Place of processing: Ireland - Privacy Policy
Additional consents: