Bicycle Carbon Disk Wheel
Background
Disk wheels (Figure 1) are highly valued by professional cyclists because of their aerodynamic performance, but their mass has also to be as low as possible, still keeping an eye on their stiffness.
In the past, disk wheels were obtained by simply using a non structural fairing to be applied on existing metal (mainly aluminium) wheels; clearly this was giving a non optimal mass.
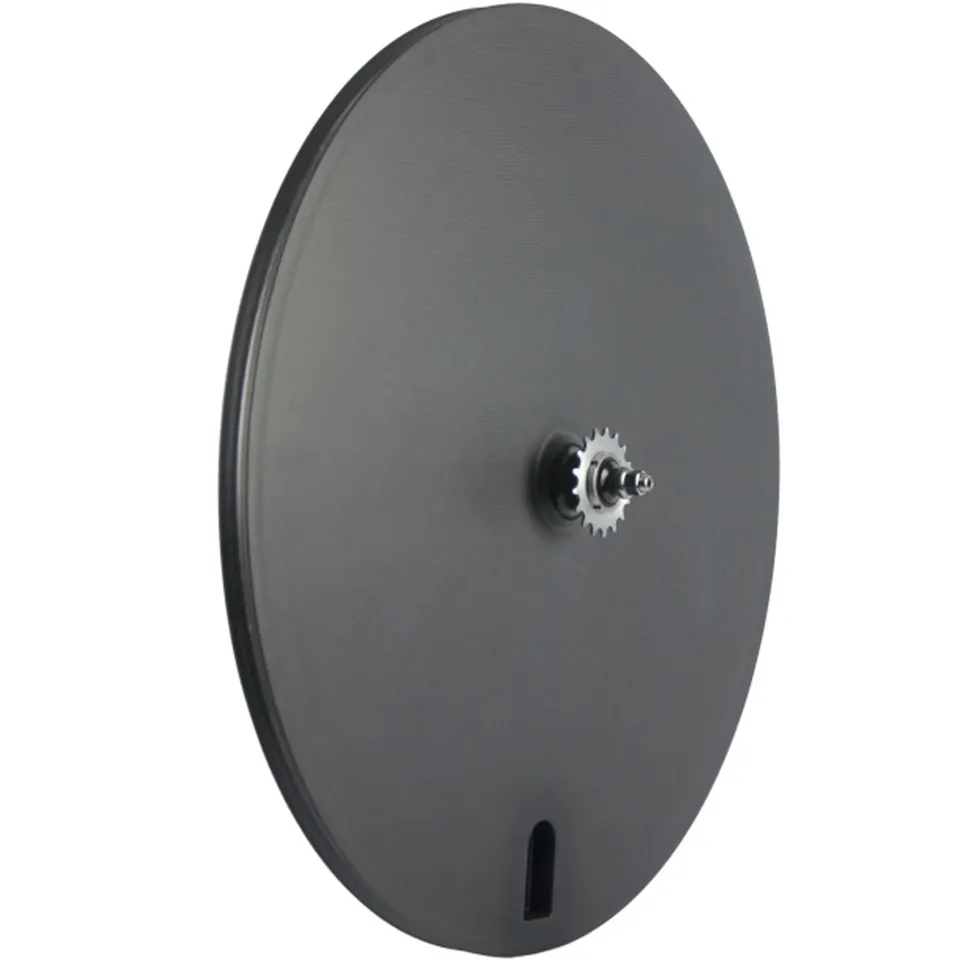
Figure 1 – A Rear Disk Wheel
The "one piece" disk wheel
Our Customer took on board the challenge to design and build carbon disk wheels (Front and Rear) with the ambitious target of a mass equal to approximately 1 kg, while maintaining the vertical and lateral stiffness values of their high level standard spoke wheels.
To reach those targets while still assuring the strength level required for safety, they felt the necessity to go through some simulation loops to achieve the optimal solution: CG CAE was chosen as the partner to perform those simulations because of our experience in Motorsport, where low mass, high strength and high stiffness are key factors to win races.
The FE Model
Because of the kind of structure, a shell element model was used for the carbon part, whereas solid elements were used to model the hub (see Figure 2).
Tire pressure, vertical and lateral loads, drive torque (for the rear wheel) were applied to the model and several iterations to seek for the best material, the best production technology (solid or sandwich), the best fibre orientation and the best stacking sequence were run.
Last but not least, because of the absence of the spokes, instability (buckling) of the side panels was something to be kept under control for all the load cases.
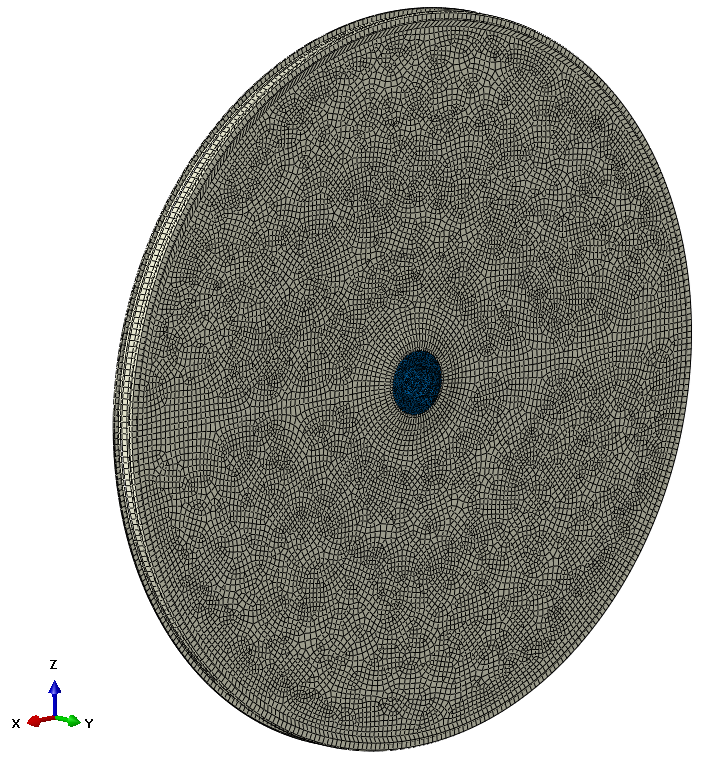
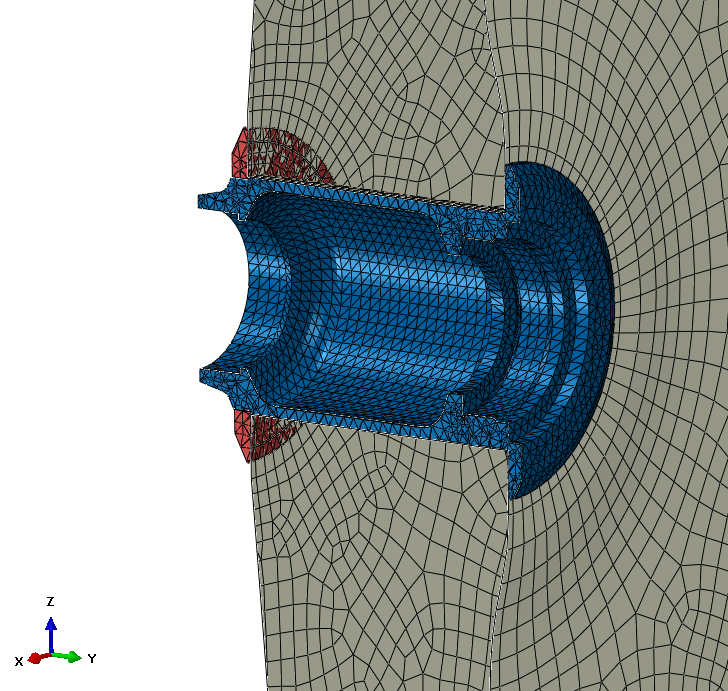
Figure 2
Some results
Figure 3 shows the Failure Index contours for two load cases, whereas Figure 4 contains the buckling shape for one load case.
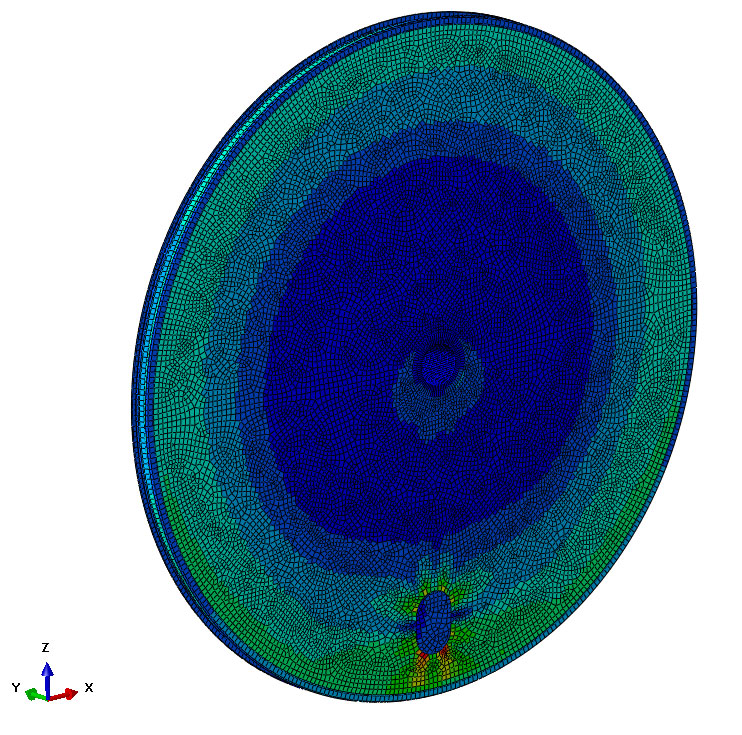
Figure 3.1 – Failure Index
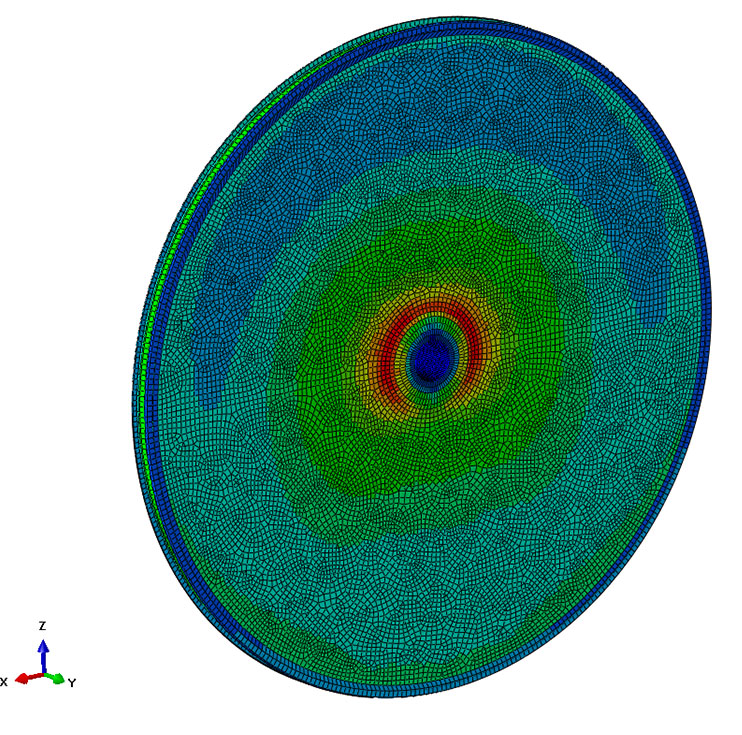
Figure 3.2 – Failure Index
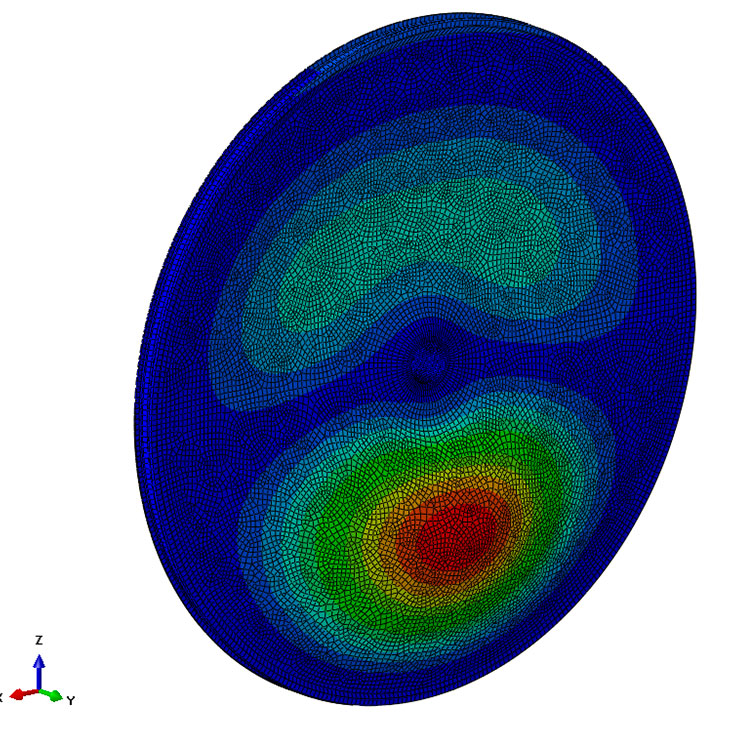
Figure 4 – Buckling shape
Finally, because the hub is glued onto the carbon structure, the bonding behaviour has been also simulated to check its resistance. Figure 5 shows the outcome of such a simulation.

Figure 5 – Bonding strength simulation
