The Buckling Analysis and Test of a PushRod for a Race Car Suspension
The double wishbone suspension system is one of the most used in racing cars and among some possible different schemes, the one that uses a PushRod to activate the elastic and damping elements (just to mention a few) is probably the most “standard” approach.
As the word itself suggests, the PushRod is a rod that works in compression and, like any slender component under compressive loads, it is prone to instability (buckling).
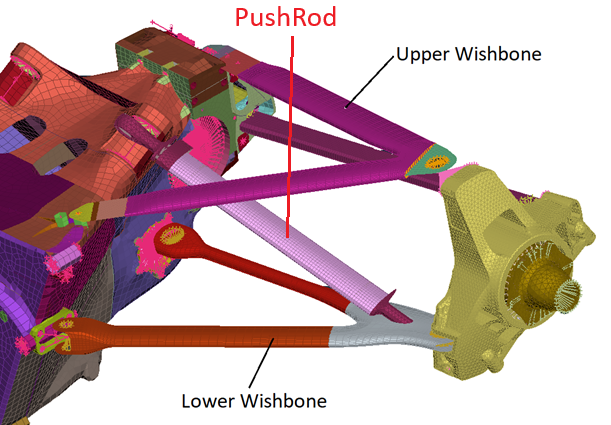
So, when sizing such a component, a buckling analysis must be carried out and considering that in general those elements can have both different cross sections along their axis and different materials, a hand calculation might be either too conservative or too optimistic; for this reason a Finite Element Model is in general used to perform at least a linear buckling analysis.
Good practice in Motorsport suggests, once the part is produced, to test it in order to check the actual Reserve Factor calculated with the FE Model, especially for the compressive load. When we correlate test data and calculation results, it is in general found that the actual buckling load is higher than the calculated one. And this is quite strange, because the model does not consider the imperfections (unless we performed a post buckling analysis that accounted for them) that should lower the actual critical load.
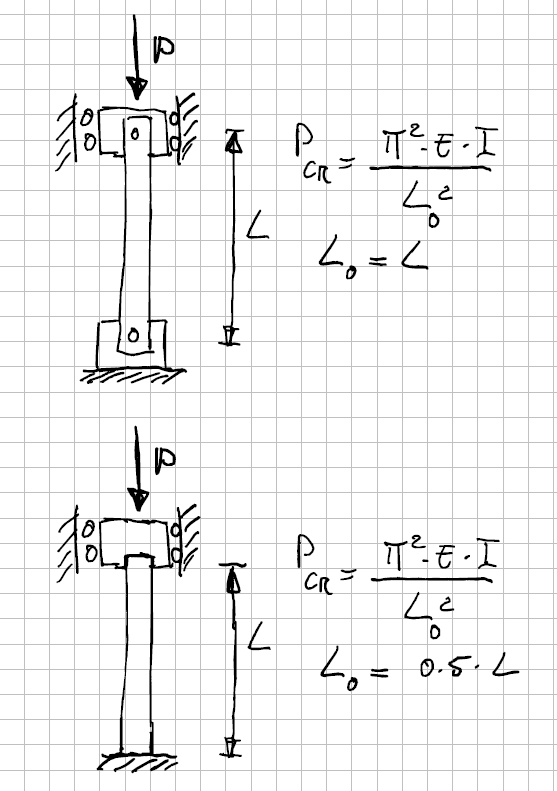
The reason of this has to be looked for in the spherical bearings (or Ball Joints) that are used to connect the PushRod to the other suspension elements: and those bearing have friction, that generates moments around the rotating point that raise the critical load, because those moments are changing the PushRod boundary conditions from a hinge-hinge connection (ideal) towards a fixed-fixed connection (see figure here below); of course those spherical bearings will not behave as a fixed restraint condition, but they are not ideal hinges neither.
So the actual situation will be something intermediate between the two conditions shown in the picture. And, as we know, the effective length L0 varies for different restraints, thus influencing the value of the critical load.
So, how could we account for this effect in our model in order to get a better prediction?
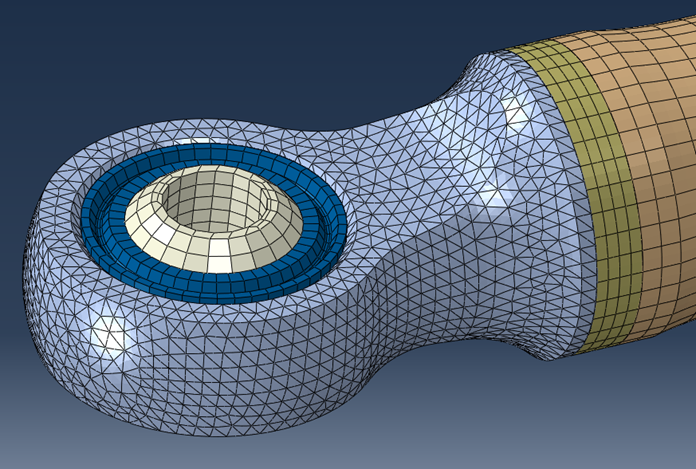
One thing could be to raise the complexity of our model, by switching to a non linear analysis, introducing the actual bearing and considering a frictional contact. The model of one end of the PushRod will look like the one in the picture here below.
With such a model we need to run a post-buckling analysis, the only approach that allows for a non linear model, as widely explained at Chapter 11 of the book Computational Structural Engineering.
The results obtained with the post-buckling analyses are summarized into the Excel graph shown here below: we have to consider that the actual test performed on two samples gave 16.2 kN and 17.2 kN as critical loads, so definitely much over the 12.2 kN provided by the linear model.
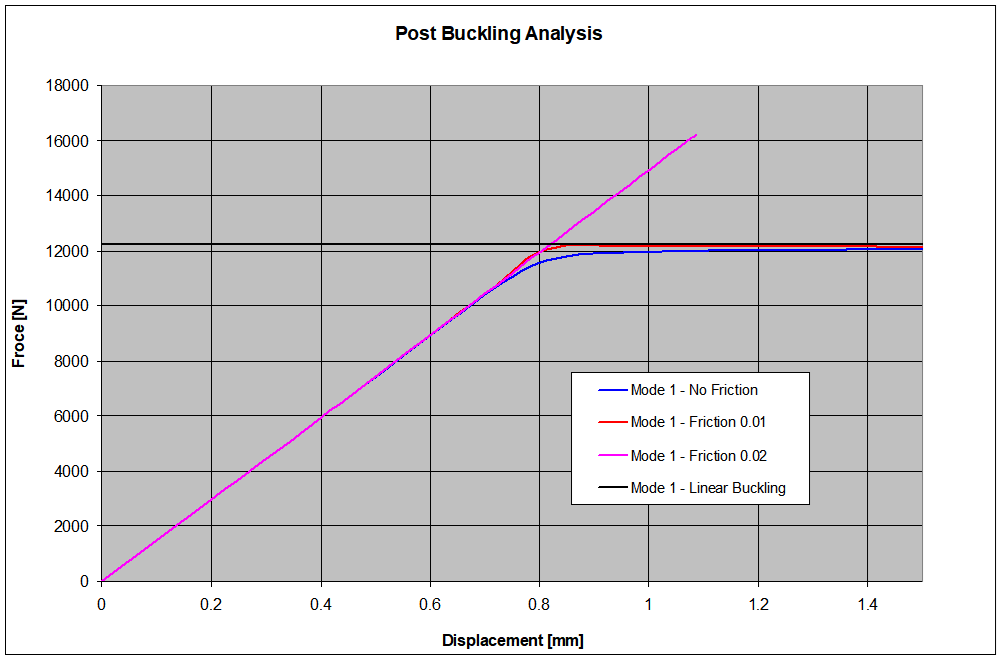
It is possible to see that between a coefficient f = 0 (no friction) and a coefficient f = 0.01 differences are pretty small: the predicted critical load is slightly lower than the value given by a linear analysis, and this is quite normal.
Then posing f = 0.02 had the effect of overcoming the previous values for the critical load, but the solution did not converge. Considering that different trials would have been required in order to match the experimental results and that the calculations showed to be quite sensitive to small variations of f, it was decided to follow a different approach.
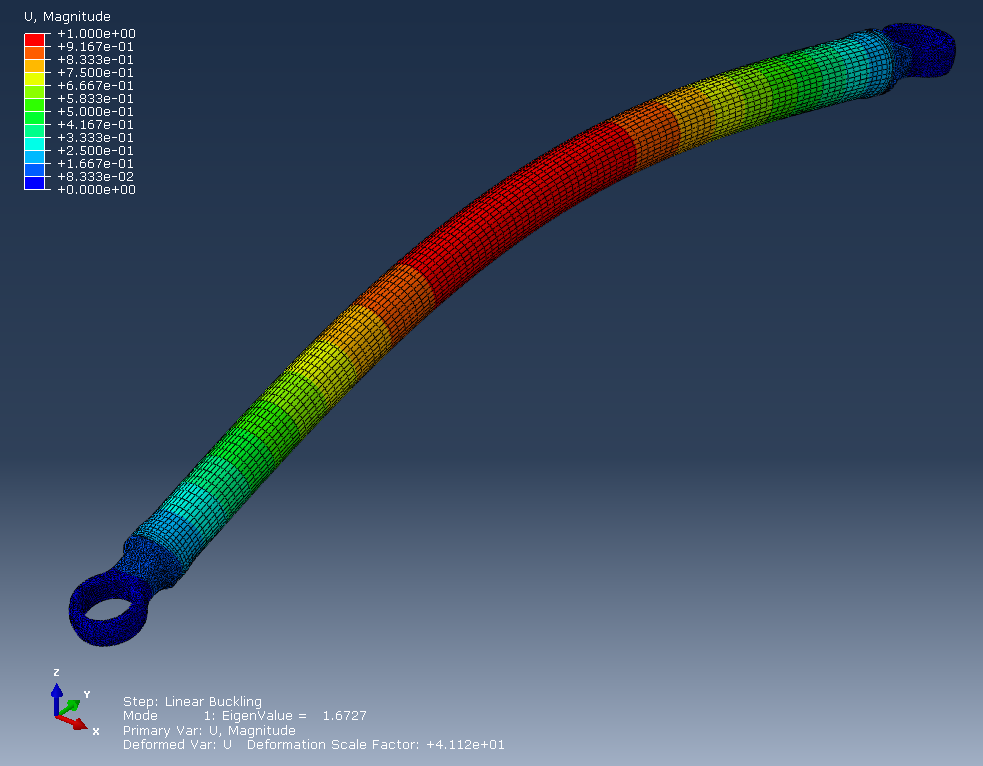
Instead of modelling the Ball Joint, a rigid MPC element type has been used to connect the lugs to the center of both the spherical joints, exactly the way it is usually done for a linear buckling calculation. Then rotational springs have been used to connect the master node to ground, while the other DOFs were restrained in the usual way.
Few linear buckling calculations were enough to find the value of the stiffness to be assigned to the springs in order to match the experimental value of the critical load. The picture here below shows a buckling multiplier of 1.63, being 10 kN the compressive force used in the model.
Clearly this approach cannot be used to predict the buckling load of a different pushrod, where the spherical joints are different, and building an historical database for different bearing sizes seems to be the only way forward, but it requires time.
It could be argued that the friction is raising the actual critical load, so why worry? This attitude is in favour of safety.
This is in general true, but what if some regulations impose that suspension elements (not necessarily the PushRod) fail below a given value?
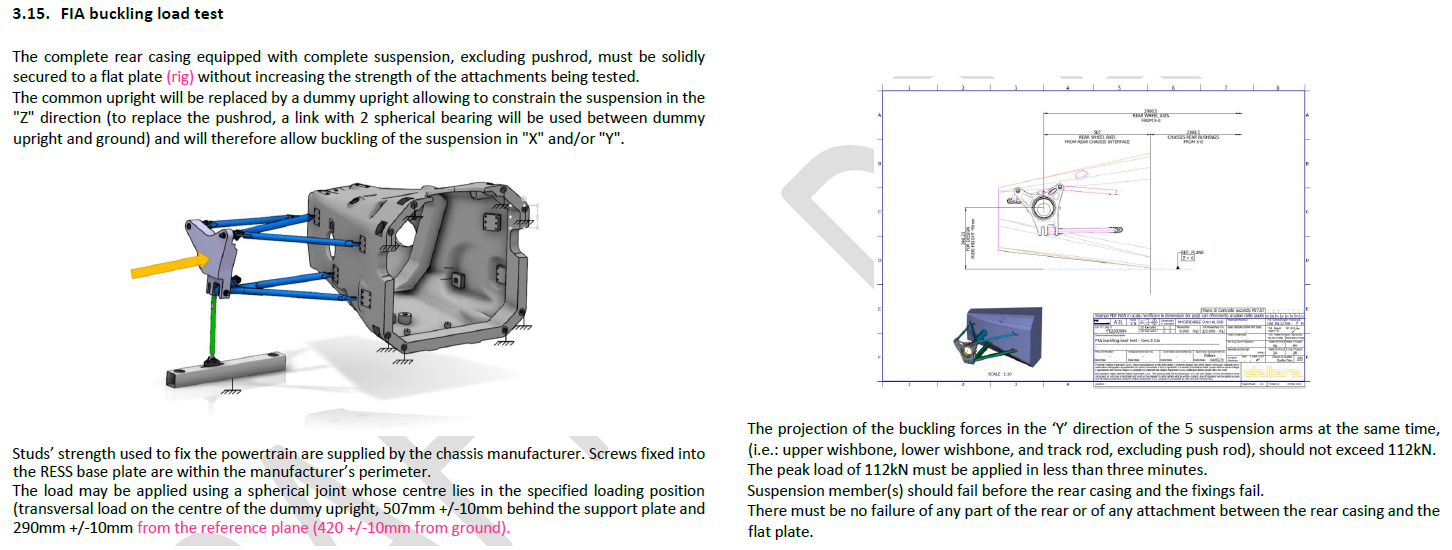
This is the case of Formula E, where the constructors have to guarantee that the rear suspension elements fail below a lateral load of 112 kN.
In such cases, then, having a too high buckling load might be detrimental and a better tool to predict the critical load of rods connected with Ball Joints is required.
But this is different story.
