Post Buckling Analysis of a Frame
This example is taken from the book Computational Structural Engineering
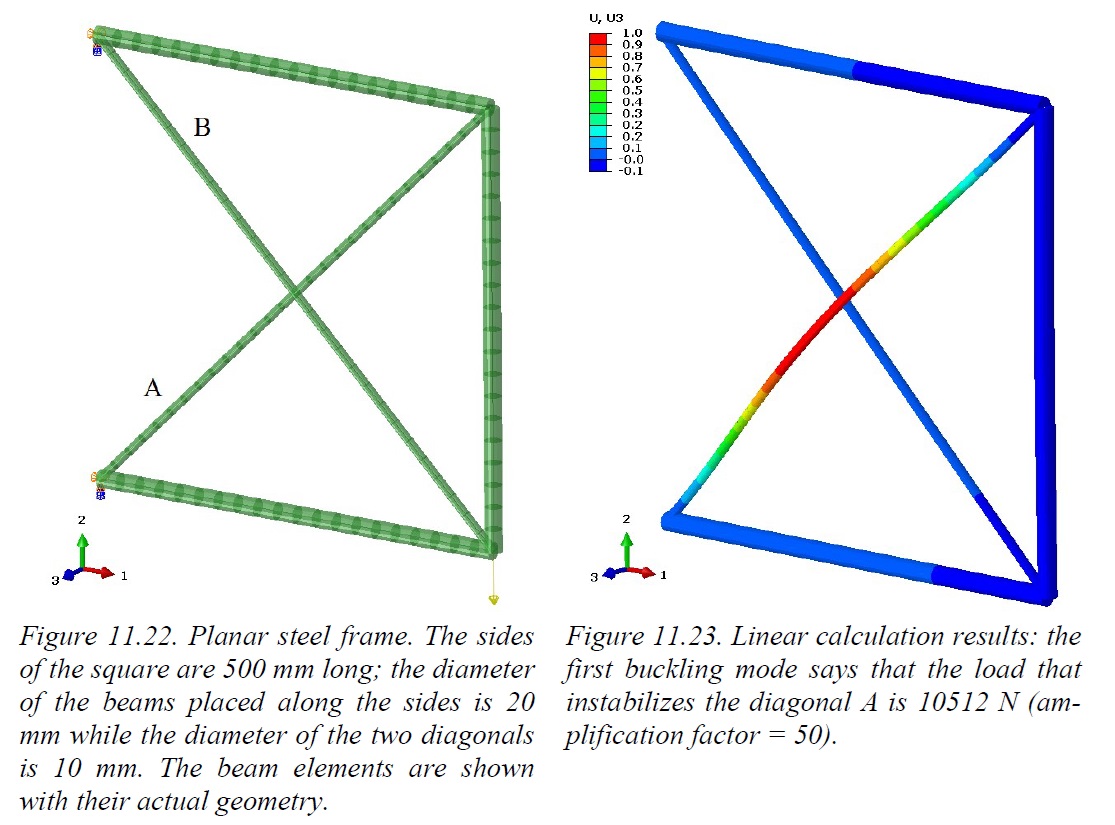
We have the planar frame shown in figure 11.22 through the related beam-type finite element model. From a first linear buckling analysis we find that Fcr = 10512 N. Clearly the element that becomes unstable is the diagonal A, as we can see from figure 11.23. We want to see what happens to the structure when we apply an almost double force F = 20000 N.
We expect that the diagonal A, which certainly is under compression, will at some point become unstable, as predicted by the linear analysis. However, the diagonal B, which instead is under tension, will not buckle and therefore the structure as a whole may not even collapse, despite having one element buckled.
A post-buckling analysis, non-linear by its nature, is then required, and large deflections have to be accounted for. How to conduct a geometric non-linear analysis is explained in the mentioned book.
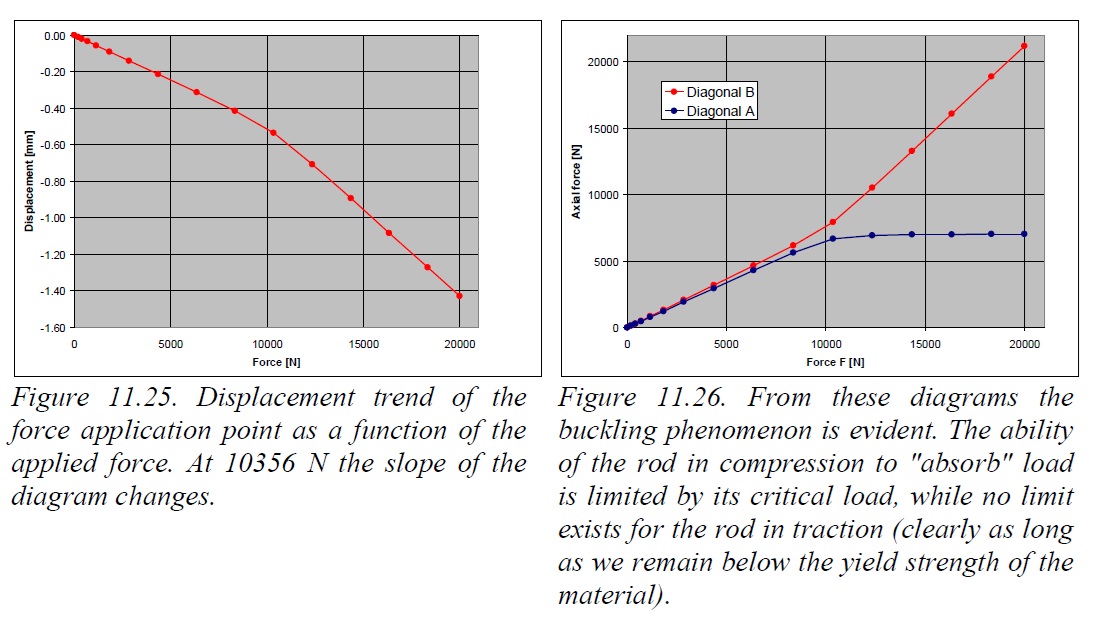
Figure 11.25 reports the diagram of the applied force towards the displacement of the application point. It can bee seen that at F = 10356 N the slope changes, in particular the structure becomes softer: this was to be expected, because diagonal A is no longer capable of reacting forces above its critical load.
More interesting are the diagrams in figure 11.26, where the absolute value of the axial load in both diagonals is reported: it can be seen that from the point where diagonal A buckles, diagonal B bears a higher rate of load, coping with the increasing external force.
So the structure does not globally collpase, provided that in any point of diagonal B the yield limit of the material is not reached. But this is a different story.